-->

Friday 20 December 2013

Big Data: A Mysterious Giant IT Buzzword

Post written by Niaz T., Senior Solution Architect/SAP BW Consultant at Ideaca. Read more about SAP HANA on her blog: Discover In-memory Technology.

In the world of technology there are a hundred definitions for “Big Data.” It seems confusing to come up with a single definition when there is a lack of standard definition. Like many other terms in technology, Big Data has evolved and matured and so has its definition. Depending on who we ask and what industry/business field they’re in, we will get different definitions. Timo Elliott summarized some of the more popular definitions of Big Data in “7 Definitions of Big Data You Should Know About.”

You may be familiar with three “V’s” or the classic 3V model. However, this original definition does not fully describe the benefits of Big Data. Recently, it has been suggested to add 2 more V’s to the list such as Value and Verification or Veracity which are resulted from “Data Management Practices.” As a BI expert who is been involved in Big Data, my approach is to have a practical definition for my clients by emphasizing the main characteristics of data and purpose of Big Data related to each specific area. I like Gartner’s concise definition. Gartner defined Volume, Velocity and Variety characteristics of information assets as not 3 parts but one part of Big Data definition.

Big data is high-volume, high-velocity and high-variety information asset that demands cost-effective, innovative forms of information processing for enhanced insight and decision making. (Gartner’s definition of big data)

The second part of the definition addresses the challenges we face to take the best of infrastructure and technology capabilities. Usually these types of solutions are expensive and clients expect to have cost effective and appropriate solution to answer their requirement. In my opinion this covers the other V which is related to how we implement Data Management Practices in Big Data Architecture Framework and its Lifecycle Model.

The third part covers the most important part and ultimate goal which is Value. Business value is in the insight to their data and to react to this insight to make better decisions. To have a right vision, it’s important to understand, identify and formulate business problems and objectives knowing practical Big Data solutions are feasible but not easy. So when I define Big Data for my clients, I use Gartner’s definition and explain the journey we need to take together to achieve their goal.

In any Big Data project, I start with BDAF or Big Data Architecture Framework which consists of Data Models, Data Lifecycle, Infrastructure, Analytic tools, Application, Management Operation and Security. One of the key components is having high performance computing storage. Since Big Data technologies are evolving and there more options to be considered, I’m focusing on SAP HANA capabilities which enable us to design practical and more cost effective solutions. HANA could be one part of overall Big Data Architecture Framework but it’s the most essential part. The beauty behind SAP HANA is that it is not just a powerhouse Database but it is a development platform to provide real time platform for both analytics and the transactional systems. It enables us to move beyond traditional data warehousing and spending significant time on data extraction and loading. In addition we’re able to take advantage of hybrid processing to design more advance modeling. Another big advantage of HANA is the capability of integrate it with SAP and non-SAP tools.

So, why am I so excited about it? Looking around I see tons of opportunities and brilliant ideas which could get off the ground with some funding. So far, HANA has been more successful in large enterprises with big budgets and larger IT staff. However I’m also interested to encourage medium size enterprises to see the potential of HANA to provide a solution for their problems. The majority of businesses don’t spend their budget to develop a solution. They are eager to pay to solve a particular problem. Now, our challenge as SAP consultants is to help businesses see this potential and how HANA can address their challenges. The good news is SAP supports by providing test environment and development licenses for promising startups.

Got your attention? Well, just to give you a glimpse, take a look at some of the success stories. In addition there are many many other cases if we look around. For instance, these days many applications capture Geo-location data like trucking company, transportation, etc. it means capturing data every 10 seconds or so from every section, every piece of equipment, every location. This could add up to a Petabyte of data! This is an excellent way to bring insight into data and drive intelligence out of it and have it circulated back to scheduling and movement processes. Another example could be companies needing to mine information from social media regarding to their products and connecting this intelligence back to their back end processes to increase customer engagement and satisfaction.

So, do you have any Big Data Challenge? With some funding, we’re able to provide cost effective and practical solution for your challenge to add value to your business.

Tuesday 3 December 2013

Web Analytics supplants Business Intelligence?

Post written by Wade W., BI Consultant at Ideaca. Read more about BI on his blog: Pragmatic Business Intelligence

In reading industry material, I recently came across a statement that can only be, in my opinion, the product of tunnel vision. It was one of the most short-sighted and fundamentally erroneous statements I have seen in some time. Analytics

“At the 2005 Emetrics Summit in London, Bob Chatham from Forrester Research described what it means to be the key. He told the assemblage that we are the leaders of tomorrow – and he wasn’t just preaching to the choir to curry favor – he made sense. Chatham told us that “web analytics” would eventually be subsumed into business intelligence, thereby changing the game. Instead of giant data warehouses being sifted in hopes of finding patterns, it would be the likes of us web analysts in charge.” (Jim Sterne, Target Marketing of Santa Barbara, edited by Erika Lindroth, The Weather Channel Interactive, Inc.)
I agree that web analytics will be (and is starting to be) subsumed into BI. However, I question the sentiment that “giant data warehouses [are] being sifted in hopes of finding patterns” and that Web Analytics would “change the game.” Is Web Analytics really going to revolutionize the art of Business Intelligence so significantly? The implication in this quote is that somehow traditional Business Intelligence is somehow inferior to Web Analytics.
I think this is an excellent example of what happens when someone seen as a leader in a field becomes too engrossed in what he is evangelizing…he becomes blind to the bigger picture.
The fact is that Web Analytics, though impressive in its power to aggregate user behaviour and use this to optimize website profitability, it is by nature a limited field. You are able to track user behaviour – generally anonymous at that – through a single customer-facing channel. Web Analytics is Business Intelligence, that only leverages a single source.

“Giant Data Warehouses,” however, are repositories of cross-organizational data, in most cases that extracted from up to hundreds of disparate data sources – Legacy systems, ERPs, CRM systems, finance, operations, HR, desktop apps, web services, external sources – and loaded into a database of a very specific architectural design optimized to return query results on the huge amounts of data very quickly.
Further, this data will certainly have different meanings across and organization – what does “Customer” mean? How do we define this? Part of the process is to work closely with the business to define common business definitions of business entities…so all that data of all that depth and breadth and richness is (should be….) based on common meanings that have been agreed to by key stakeholders. We can mine the data to identify unknown customer segments. We can do Predictive Modeling. Starting with a business mentality, there is the potential to leverage some powerful Business Intelligence.
But I do agree that Web-sourced data represents a substantial opportunity. We can take those Web-specific data sources that power our Web Analytics Apps, and add that to the existing Data Warehouse, passing through the same business rules to ensure heterogeneous data has a single meaning. Now we are talking organization wide, multi-source Business Intellligence.  Plug BI’s powerful analytical tools into our database, and with some targeted, business-driven KPI’s, and we have another, very powerful means of driving profitability
Web Analytics could be said to be proportionally less expensive than traditional BI – same basic cost range for the analytics tool, but less demand for investment in multiple software licenses from different vendors (possibly), less complex data massage (or not…) and shorter time to implement.  And that in itself is a strong argument in favour of Web Analytics – reduced time to market.  However, you won’t have the spectrum of information you have in a well-implemented Data Warehouse.
I believe that Web Analytics is a complement to BI. It can be integrated into a dashboard, or can stand alone to guide developers and webmasters to optimize content. It does have an effect on our database architecture – we must adapt the design of the database to integrate web data. But does it “change the game”? No – it  makes it more interesting. And as a Business Intelligence professional, I welcome another tool that will add value to my service offering and to my clients.
Wade Walker

Monday 2 December 2013

Ideaca To Become Hitachi Solutions Canada!


Same people, same values, different name

On December 2, 2013, Ideaca was officially acquired by Hitachi Solutions and will become “Hitachi Solutions Canada.” As Hitachi Solutions Canada, we look forward to providing our customers with a wider array of proven industry solutions and access to global resources.

"Ideaca is extremely pleased to join a global brand with the outstanding caliber of Hitachi Solutions,” said Muneer Hirji, newly appointed president of Hitachi Solutions Canada.

“We look forward to integrating our experience and strengthening our synergies to bring great industry-focused solutions to both regionally-focused and multinational companies throughout Canada. With its long history of technology excellence, industry leadership and employee-driven culture, Hitachi Solutions will make a great home for our employees.”

Our name may be changing, but our people and our values will stay the same!

Click here to read more.

Tuesday 26 November 2013

How Technology Changes Us: Canada In 10 Years

Post written by Niaz T., Senior Solution Architect / SAP BW Consultant at Ideaca. Read more about SAP HANA on her blog: Discover In-memory Technology.


The theme of the Ideaca Blogging Network for the month of August is a very interesting subject. Certainly, technology changes the way we do things on a daily basis. Not only in Canada, but also globally. There could be some specific cases in Canada, such as Green technology to combat climate change. However, most of the technology changes impact us globally, specially in more advanced countries.


The first thing that it comes to my mind is technology will enable us to convert Zettaflood (10 to the 21st bits, or a thousand exabytes) of data in to meaningful information which we are very dependent. Like it or not, business intelligence already has an increasingly important part of our life. The challenge will be how to deal with the explosion of data coming from all types of gadgets and smart technologies because value-based intelligent information helps us to get things faster, better and easier. The speed of rising adoption of cloud, mobile, real-time applications and social technologies and exponential data growth is a big challenge of staying current.


How technology solves this challenge? Some of the biggest improvements have been around networking. We will be able to move more data faster from many sources and applications to where is needed. We won’t have any restriction in terms of capacity, scalability and processing speed. Organizations will be able to leverage the three “V’s”, volume, variety and velocity, of data to augment the value of data for their decision making. Powerful in-memory technology such as SAP HANA enable us to design complex predicative and preventative models for all type of data from structured and unstructured like audio and video files. Next generation of data visualization and intelligent reporting tools empower users to slice and dice information any way it is demanded. We will be able to tell stories with data by connecting millions of data points to get a bigger picture. Big data will change our world and it will blow our mind by providing us tons of opportunities. It will make our word smaller and we will be all connected.

I believe in the next 10 years, another significant change will be human and machines interaction. It seems that human interaction, communication and relationships will be more efficient, faster and stronger through smart technologies. Also, we will be able to have better understanding of machine behaviors and machines will have a better understanding of ours. Ideally humans and machines will work alongside each other and hopefully not replacing human with machines. Although there are ongoing developments and opportunities to replace human with machines, it’s required to consider all potentials dangers and associated risks.


Personally, I’m very excited to see how technology will enable us to access information easily, increase our potential and creativity, improve our lifestyle and promise of longevity, and improve communication and social networking. On the other hand, I believe we need to keep things in balance with respect to human identity and our social behavior. For example, neuroscientists are concerned about how modern technology is making us not use our brains to their full potentials. Based on the evidence, loneliness and depression is increasing and people are less happy in modern society. It’s been observed that the newer generation—equipped with all kinds of smart technology—is less effective in terms of communication skills and human interaction.


The bottom line is we use technology to change the world to suit us better. The important thing is to control it so it doesn’t destroy human intelligence and social interaction. For instance, it would be great to get a relaxing massage after a long day by a smart robot that has already taken care of the house chores. However, nothing will replace a nice face to face conversation with your favorite person or a warm friendly hug to someone you care about. I don’t think we could ever replace our human connection with human-robot connection.

Friday 8 November 2013

Is Big Data Only About…Big Data?

Post written by Wade W., BI Consultant at Ideaca. Read more about BI on his blog: Pragmatic Business Intelligence.  

If nothing else, IT is all about buzzwords, and “Big Data” is one of the new arrivals to the party.
It is, however, a descriptive one. “Big Data” evokes images of enormous relational databases, providing analytical (or operational) reporting.

Big Data is not only about size however. Rather, it refers to attributes of the data that together challenge the constraints of a business need or system to respond to it. Those attributes can include any or all of attributes such as size/volume (of data), speed (of generation), and number and variety of systems or applications that simultaneously generate data. Another thing that is unique about Big Data is how it varies in structure. Elements of “structure” would include the diversity of its generation (eg. Social media, video, images, manual text, automatically generated data, such as a weather forecast, etc), information interconnectedness and interactivity.

I heard somewhere a thumbnail statistic that 80% of data in companies is unstructured or semi-structured. Just to clarify the meanings of those terms, an unstructured data artifact would be a document, an email, a video or audio clip. A semi-structured data artifact would include data that does not conform to the norms of structured data but contains markers or tags that enforce some kind of loose (or not so loose) structure. XML documents would be an example of semi-structured data.  Tagged documents in a Knowledge Management system would also fit into this definition.

Structured data is what we would find in any database – a Data Model has been defined and the data is physically arranged within this model into tables. The data in these tables is described with metadata (i.e. data types (such as “character”) and the maximum length of that data (number of bytes)).

The methods of data creation are multiplying and the velocity of its creation are increasing. And that, in itself is a complicating factor. Some analysts (IDC, for example), predict that the Digital Universe -  that is, the world’s data – will increase by 50x by 2020. There will be in the same period, a growing shortage of storage, which will drive investment in the cloud as both individuals and corporations look for scalable, ubiquitously accessible, lower-cost and environmental data storage options. In addition, the same study predicts that of all that data, unstructured data, especially video, will account for 90% of that data.

There is also an important historical dimension to Big Data. For decades, companies have been hoarding structured, semi-structured and unstructured data in hopes of one day being able to extract value from it at some point in the future.

A large percentage of all this data will come with a wrapper of automatically generated Metadata – that is, (as indicated above), data about (or that describes) that data. A practical example could be the generation of a data artifact coming wrapped with metadata from those GPS enabled, media rich, socially linked mobile devices we all carry with us that transparently capture location, GPS coordinates, time, weather conditions and a plethora of other data elements when you click that holiday photo with your mobile phone. IDC predicts that such metadata is growing twice as fast as data.

It is clear from the last three paragraphs that Big Data describes explosive growth in data and metadata and an equally explosive opportunity to capture, tame and corral that data to extract value from it.

So the case has been made that we have a lot of data today and we will have even way more tomorrow, but should your organization be investing in Big Data today?

In a sense, probably you already are. Enterprise Business Intelligence environments lay a solid foundation for the next phase of Big Data. EBI is an earlier iteration of Big Data and, married to tools such as Hadoop and NoSQL databases for example, enable a natural evolutionary growth curve to your mastery of your information ecosystem.

Big Data has a requirement for a new way of thinking, new tools, clustered commodity hardware and probably, substantial investment. It comes down to your business, and if there is a clear value-based case to present that data to your company’s brainpower. The actual needs for this will be radically different depending on your industry. Oil and Gas may be interested in leveraging real time alerts in wellhead data or analyzing petabyte seismic datasets.  Packaged Goods multinationals may be interested in monitoring and engaging advocates, detractors and influencers across multiple Social Media platforms, mining and understanding sentiment and identifying problem areas in real time in order to identify opportunity or identify and avert potential brand-damaging events. Financial institutions may be interested in monitoring international money traffic to identify fraud or illegal activity. Government entities may mine extremist forums, or other unstructured data traffic to identify national threats.

Big Data can serve these needs in real time, enabling rapid (or even automated) response to flagged events. Whether it is a fit for your organization today would be determined through viewing your industry and business through a critical lens on your current Information Intelligence maturity, a strategic assessment of the data and information assets currently owned or available to your organization, and a prioritization of potential initiatives. How much data you harness and convert into information should be a key outcome required from this exercise. The opportunities are legion, but initiatives should have clear objectives and success metrics understood prior to a project kickoff.
Whether it is today or tomorrow, Big Data is becoming mainstream through necessity. Whether that is a road your organization wants, or needs to drive today, is something all medium and large organizations should be considering now.

What are your thoughts on Big Data? Is your organization currently considering Big Data as a strategic imitative or Proof of Concept?

Thursday 31 October 2013

Project Management and Big Data – as a project

Post written by Jason Z., Project Manager at Ideaca. Read more about project management on his blog: Unnatural Leadership.

As part of this month’s Ideaca blogging network challenge, we were tasked with discussing our thoughts on Big Data.

This is going to be a 2 part post:
  • The first part will cover how you, as a project manager, should approach a project that carries the mantle of “Big Data.”
  • The second part will cover how you, as someone in a Project/Program Management Office, can use Big Data without getting snookered by the hype.
Part 1 – So you’ve been asked to “implement Big Data”… what now?

Defining Your Terms
I am going to assume that you – like me – tend to be baffled by the marketing speak until you can speak with someone intelligently about a topic. In the case of Big Data, I have heard a few definitions. The one that seems to stick the most for me is the one from Wikipedia:
  • Data sets that are too big for traditional database management systems to handle
  • Data sets that comprise information from multiple sources to try to infer correlation
Sounds easy enough, right?
Where it starts to get complicated (thanks Wade!) is when you try to integrate “unstructured and semi-structured data with our 'traditional' structured data.”

You will never “implement Big Data”
When it comes to Big Data, you do not implement it. You may be implementing a technology to support the analysis, but you will never actually implement this “thing.” A project of this sort relies on understanding the user requirements, selecting the right technology, and taking an exploratory approach when developing reporting capabilities.

Understanding the User Requirements
In the case of a new process and technology, such as this, your user requirements may be fairly light. "We want to correlate information from disparate sources to identify predictive trends” or “I don’t know – but I really want some cool looking reports” may be common lines that you hear. Like all projects, the user requirements are your definition of success. Because “Big Data” is still a technology in the exploratory stage, though, expecting detailed requirements may be the wrong sorts of requirements. The ones that you should be really focused on are the data sources and ensuring that the information being presented is right.

To wit, if I were to ask you to present the information on the average CEO compensation for the top 50 companies in North America, how would you start? How would you define the Top 50?  By Market Capitalization? By Environmental Performance? By Stock Price? By Revenue? What about getting access to private company information? All of the sudden, a fairly simple question about the average CEO compensation gets a little more complex.

The same will be true of your Big Data project. Start by understanding that to present the information your users want, you will either have to ask a whole lot of detailed questions, or provide a platform to enable them to answer their own questions.

Understanding the available technology
As Project Managers, we know that when we are asked to Implement something, it’s never that simple. Understanding what the technology can and cannot do is critical to ensuring that your project can meet the user’s definition of success.

One might want to satisfy the guiding principles of a company’s Enterprise Architecture. A quick scan of the landscape will reveal that tools like SAP HANA, Oracle’s Exadata, and Amazon’s AWS can all fulfill the technology requirements quite nicely and potentially support a company’s Enterprise Architecture. However, since this is a new application of technology, fulfillment of requirements needs to trump Enterprise Architecture.

Take an Exploratory and Iterative Approach to reporting
Some organizations will judge success of your project by its ability to deliver a load of reports. If this sounds like your organization, be realistic as to what can be delivered. Deliver a robust and reliable dataset, some transactional reports, and one report that really helps demonstrate the art of the possible.

Smarter organizations will judge the success of your project by its ability to deliver analytic capabilities to the user base. The robust and reliable dataset is still mandatory, but the ability for users to generate their own reports will satisfy all of the “what about …?” requirements that would blow your project budget and schedule out of the water.

In the end… it’s the people that matter
If we believe all of the marketing hype, Big Data will help us explore all the myriad of ways our world is constructed. But from the perspective of a Big Data as a project, an empowered user base will produce much more value than some canned reports.

Have you been asked to “implement big data”?
If so, what did your project look like? Let me know in the comments down below. Stay tuned for another post on making the most of Big Data in a PMO.


Special thanks to Wade Walker and Chris Sorensen for keeping me honest with this post.

Wednesday 16 October 2013

Just Imagine...

Post written by Chris S., BI Consultant at Ideaca. Read more about BI on his blog: The Outspoken Data Guy.

For quite some time I have been imagining what the possibilities of Big Data might be. I am certainly no expert in the area but being the data guy that I am, I often wonder what might be able to be done with data that may be being collected at any point in time. Face it, we are so connected now that our every move generates some form of data and often multiple pieces of it.

For example, if a marketer wanted to know everything about Chris Sorensen in a given day, chances are that most of that data is logged somewhere. What time I leave my house is available via my cell phone, my driving directions and speed are also available there as well. When I sit on the train I surf the web, send emails and organize my task list, all of these actions generate recorded data. What time I log into work, how often I am active on my computer and what I am do all day long is logged. Where I shop, what I buy (if I have a rewards card) is all tracked. My Facebook views, tweets all contain things that could be used to build a personality model of myself and my habits.

It is not really that big of stretch to think that this data could be used in one gigantic model to predict my next move and perhaps even entice me to make a different one. Maybe instead of stopping at Home Depot to get my painting supplies, an app could suggest the best place for me to go based on what I am doing. Sound like a stretch? Not really…Think about the labor that gold miners went through just to get a few stones. Now gigantic machinery does the same thing. The same thing is happening with Big Data where machines are able to gather information from a variety of sources and store large volumes of it in order to form predictive models. We are only at the tip of the iceberg but just imagine what the possibilities might be

Thursday 10 October 2013

The importance of a shared vision

Post written by Jason Z., Project Manager at Ideaca. Read more about project management on his blog: Unnatural Leadership.

In a post from my series “Advice for Junior PMs," I touched on the concept of saying what you mean when working with your project team. The same concept should be applied when communicating outside of your project team.

There’s a fairly common graphic that gets passed around IT departments, and it’s somewhat self-deprecating. It shows that project teams tend to not understand what the customer needs – which is endemic of lacking a shared vision.

This graphic makes me cringe every time I see it.

As we all know, a project is a temporary group activity designed to produce a unique product, service or result. However, more often than not, project teams take an “I know best” view of the world when designing solutions for their customer.

A strong project manager will not only sit with their customer to understand what is required, but will bring the whole project team along to understand as well. We all have our own perceptions and filters, and as a result may play broken telephone.

At this point, you may be asking if a shared vision is different from the project scope statement. It is, in that the shared vision is what the customer will see as the product, service, or result of the project, whereas the project scope is everything that will be delivered (including training, documentation, organizational change management).

To create a shared vision of what the project will produce (be it a unique product, service, or result):
  1. Bring everyone to the table to ensure open communication
  1. Define what is to be produced in simple language – do not say “we are going to produce a tree swing,” and leave it there, say “we are going to produce a tree swing, which is comprised of a tire hanging from a sturdy branch of a large oak tree by a piece of polyester rope.”
  1. Involve the customer in design meetings. Subject Matter Experts (SMEs) should definitely lead, but should be eliciting feedback so that the customer’s requirements are re-confirmed by the team.
  1. Revisit the shared vision often. Ask your customer at difference acceptance testing points if what is being developed meets the shared vision.
Most importantly, communicate the shared vision often. Use it as the first line in your status reports, use it as part of your elevator speech, and when people ask you what you are working on, relay your project’s shared vision.

What are your tips for creating a shared vision? What have you seen work well? Do you have any stories of spectacular failures? Share your tips and stories below!

Tuesday 8 October 2013

Standards = Starting Point

 Post written by Wade W., BI Consultant at Ideaca. Read more about BI on his blog: Pragmatic Business Intelligence.  

In a data migration project, standards are synonymous with quality.

Every developer has a different philosophy of what works. Many say that it is easier to develop with “what I know," which sounds a lot like “quick and dirty."

The definition of, or existence of Standards of Development and Naming Conventions provide guidelines within which developers should be expected to work. Without these, your environment quickly becomes rife with development packages, interfaces and jobs with different naming conventions, different approaches and widely varying levels of development quality.

I think it is common that, lacking a mentor or some kind of guidance, developers new to data migration start the same way – monster jobs, lack of flexibility, lack of clarity…and lack of documentation. Result: effectively, unmaintainable, throw-away jobs.

The good news is, as discussed, there is a remedy: Take the time to define standards, or work with a supplier who uses a proven methodology based on established standards and quality-centric processes…ideally processes that can be templated and reused.

Re-usability of processes (i.e. “templates") should be your objective. Ensure that in your environment, your team lead is responsible to establish a set of skeleton templates (say 5-10?) that 95% of all your data migration mappings can be based on. “Skeleton” templates means that they are pre-populated with the parameters (that’s “placeholders” for the project-specific values) – these skeleton templates contain no table structure information – just as much development that can be reused in all cases.

Once you have this in place, you can quantifiably calculate substantial cost savings just from having these templates in place… from every project.

Really.

Tuesday 1 October 2013

Sliced or Shaved? Avoiding spreading your BI team too thin

 Post written by Chris S., BI Consultant at Ideaca. Read more about BI on his blog: The Outspoken Data Guy.

As a consultant with a background in Agile, I often get questions about how Agile can be used to solve certain problems that people are having with their Business Intelligence Programs.

I recently sat with a client to listen to some of the issues that they are currently having with their BI program. One of the biggest issues that this client is facing is what I would classify as a simple supply and demand problem. Basically their team of around 8 people cannot keep up with the demands of developing and sustaining their BI/DW environment in what is a large organization. The main question for me was could Agile help solve this problem. In my experience, Agile cannot solve the problem directly but it can be used to highlight the root cause.

This is a very common problem that BI programs face. It is the fact that teams are often small relative to the size of an organization and are also too small to manage the tasks that they need to perform to grow and maintain a BI portfolio. And in certain circumstances it is compounded by the fact that teams are often staffed with the wrong skills sets needed to grow and manage a BI offering.

So how can Agile help?

With proper tracking and monitoring of what the team does on a daily basis, teams can begin to gather data on what types of work the team is doing on a daily basis. What we often find is that at a certain point new development will stop coming from small teams charged with both the development and sustainment of a program as they cannot keep up with both. The ironic thing is that most BI managers have no real data to back this up. So taking advantage of some of the rigor around agile in terms of tracking what is done on a daily basis and how slowly new work burns down, one can begin to understand and report better on how time is spent and in fact how little time is available to delivering new functionality.

Thursday 26 September 2013

Social Analytics meet Business Intelligence

 Post written by Wade W., BI Consultant at Ideaca. Read more about BI on his blog: Pragmatic Business Intelligence.

If your company is a well-known brand, somebody, somewhere is publicly talking about it. Right now. It may be on your own Social channels, in an Internet forum, a blog or other user-generated content site. Social Media Monitoring, which put simply is keeping a constant eye on Social sites including Twitter, Facebook and hundreds of other platforms to monitor what is being said about your brand, has become a necessity for most large organizations, and it is an art and a science to manage this well.  Manage it badly, and you can have a catastrophic image issue (i.e. the 2010 Nestle Palm Oil debacle on Nestle’s own  Facebook page).  Handle it well, and you can cement a solid relationship with existing clients and convert new clients to your brand (i.e. HP’s little-known but truly brilliant efforts to provide temporary replacement HP hardware to certain individual users on social platforms complaining of broken computers).

From a commercial aspect, companies are increasingly looking at Social Media to contribute to driving revenue, largely through lofty concepts such as “engagement” and “conversion.” Social is unique in not only the speed of the communication, but also the intimate nature of content.  In addition, and importantly, what companies must understand is that in the Social realm, the customer controls the conversation. The implication here is a fundamental paradigm shift for Customer Relationship Management and Marketing, to understand the customer on a personal level, and to handle – with great sensitivity – both the positive and negative sentiment expressed on Social platforms.

(Social) Business Intelligence
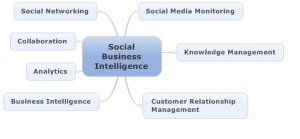
A growing and compelling new flavor of Business Intelligence is attempting to tap into the unstructured content on social platforms and attempt to structure that data into a format that can be analyzed and mined using new methods such as Sentiment Analysis, which measures the aggregate sentiment across user posted content. Social Business Intelligence uniquely sits in the convergence of Knowledge Management, Social Media Monitoring, Collaboration, Social Networking, Analytics , Customer Relationship Management (CRM) and Business Intelligence (BI).

 Social Business Intelligence is at a unique convergence point between several key technologies.

Social Business Intelligence is at a unique convergence point between several key technologies.

First, there is an important roadblock to get out of the way. Today there are a selection of tools to do everything I am discussing below in one way or another.  With a simple sentence I have rendered technology irrelevant for the purposes of this blog. So let’s focus on what Social BI is, how it is done and what it means because that is what is important to business.

I’m not really a catch-word kind of guy, but this is Big Data in its truest form. There are thousands of platforms and sites, of course, but if we only talk about  the current Big Guys (Facebook, Twitter and Foursquare for example), this would add up to billions or trillions of conversation segments over a given  (even conservative) time horizon. To put this in context: that customer data warehouse you have built over all these years probably doesn’t come close…

Social Business Intelligence offers both Internal and External Opportunity
There are both internal and external opportunities to be realized through Social Media Business Intelligence, and many tools are evolving to support these, some even going so far as to adopt a “Facebook-like” or “Twitter-like” interface, mimicking social interaction and Social Networking site features.

Social Business Intelligence applied internally to an organization could be termed Social Collaboration. For example, certain tools might feature collaborative review where colleagues can ask questions and link those answers to specific reports, or collaboratively comment and markup objects such as Business Intelligence ad-hoc analytics,  graphs or reports. This functionality to comment in real time on powerful business intelligence (even if it is only based on Traditional data sources that exclude Social Media data) has the potential to add value to interpretation of the reports that companies produce and use today to base key decisions upon, thereby potentially improving decisions made from today’s Decision Support Systems. Many traditional software vendors already have adopted such functionality.

Of course, where Social Business Intelligence as a disruptive technology becomes particularly interesting is when we start gathering and analyzing that unstructured user-generated content, or even more compelling, when we combine it with our existing “traditional” Enterprise Analytics environments. This empowers organizations to produce new innovative products that target user segments more accurately and respond better to customer support or relationship development opportunities. The value of Social Business Intelligence is not really “about” the frequency of words and phrases users post on social platforms. The value is in segmenting, categorizing, mining and understanding the aggregate of the users’ behavior, and the sentiment of those posts across products, segments and channels.

Social Media has its own unique segments, which include Employees, Partners, Influencers, Detractors and Advocates. We can analyze social network traffic, understand and identify our segments, and tailor personalized/semi-personalized interaction to individuals or one of these segments,  flagging key comments, monitoring Likes, +1’s, trending subjects and use of hashtags, enabling rapid and targeted response to user comments to avert public relations crisis, measure success of our Social Marketing programs or capitalize on new opportunities.

It’s all about the conversation. And you don’t control it.
Again, companies need to understand that the customer controls the conversation. However, the tools exist that can arrange and present structured knowledge from unstructured noise, providing key information input to areas such as Marketing and Manufacturing to be responsive and agile, acting on data that correlates highly to real-life fact.

At its root, Social Media is about the conversation. This implies new requirements for how to manage our link to the customer, and how to most effectively target and market to them. Increasingly, consumers are mistrustful of the marketing messages and advertising. They are more likely to find more relevance and see more value in the reviews and purchasing of their friends and peers.

Social Business Intelligence in Practice
I thought to finish, I would provide two examples that support the claim that through mining user-generated content, we can correlate with very high level of confidence, to known and validated facts.

Google Flu Trends
An example of single-source user generated content analysis is  Google Flu Trends.  Google has been analyzing aggregated web search terms to see if it is possible to correlate geographic frequency of user search terms on Google’s search engine to real data on flu epidemics.

While I recognize this is not Social Media  per se, this example is very relevant to the argument that user-generated content can be tied to sentiment and can also be used as a predictor for future events, when we clearly understand and define the objective, then identify and measure indicators supporting that objective.

Google’s site http://www.google.org/flutrends/ca/#CA provides up-to-current-day results to allow tracking of current and developing flu incidents and epidemics. In addition, on this site there are historical graphs over a multi-year period for regions around the globe that prove, using known, validated historical data, that reality and future events can indisputably be predicted by user-generated content.

United Nations Global Pulse.
Between 2009 and 2011, the United Nations and SAS studied how Social Media and other user-generated content from public internet sources such as blogs, Internet forums, and news published in Ireland and the US could be correlated to validated statistics and leveraged as a compliment and an qualitative indicator of real-life events.

For Global Pulse, the focus was on employment status. To summarize from the document found at http://www.sas.com/resources/asset/un-global-pulse.pdf,  the UN identified keywords indicating changes in employment status (i.e.”fired”), level of anxiety (i.e.  “depressed”) or economic indicators (i.e. loss of housing or auto repossession, cancellation of vacations) in order to  monitor sentiment.  The results were astonishing. The analysis of sentiment allowed them to predict  increases in unemployment as much as four months in advance of an uptick in unemployment claims with a 90-95% level of confidence. Further, they were able to predict precisely, again with a 90-95% confidence, how long after an uptick in unemployment that there would be an increase in clear economic indicators in the form of talk of loss of, or negative changes to housing, changes of transport method or cancellation of travel plans.

These two examples underscore that user-generated content in the social realm represents a new and potentially highly accurate source of knowledge when tied to clearly defined objectives and supporting metrics (leveraging appropriate keywords). Indeed, Social Media Business Intelligence has the potential  to facilitate very personal customer understanding and when backed by a well defined strategy, to strengthen the relationship with our customer, avert PR disasters and increase customer engagement and conversion.

What are your thoughts? Is the world ready for Social Business Intelligence? Has your company thought about imposing order and structure to the chaos that is Social Media user-generated Content?

Tuesday 24 September 2013

You've Collected Data...But Now What?

Post written by Peter T., Management Consultant at Ideaca. Read more about visibility on his blog: Visibility.

The list of technologies that allow us to capture vast amounts of data is quite extensive. This list varies in magnitude of use and exposure within organizations. Companies today can, and most often do, use multiple means of collecting data, such as: Spreadsheets, Databases, Operational specific Software, Enterprise Systems; ERP, CRM, HRM, Various Portals; Personal Portals, News Portals, Enterprise Information Portals, Self-Service Portals, e-Commerce Portals, Collaboration Portals… And the list goes on and on.

It is very evident that companies are really good at collecting data. Whether the data management function within an organization is primitive or advanced, gathering data in spreadsheets or in elaborate enterprise systems and databases: the majority of organizations are great at data collection. Hard copy, Soft Copy, e-Copy, web displayed; data in all forms, shapes and sizes is being collected at an enormous pace. If you can write it, print it, draw it, type it, sketch it, draft it, and capture it, you can rest assured it is being gathered.

The question is not what data to capture next, but now that we have all this data, NOW WHAT?  
Once data is collected, do organizations use it in the most efficient way? The overarching question is: now that you have all this data, what value are you getting from it? The following are five steps that will assist organizations in gaining the most value out of their data.

STEP 1 – IDENTIFY YOUR VALUE DRIVERS
Before we can successfully answer the question of value derived from data, we need to understand what the value drivers are for an organization. Are the value drivers; profitability, reputation, market share, productivity, customer service? The list can certainly be expanded upon. Getting value out of your operational data is imperative, but if you don’t link the data that you are capturing with the value drivers of the organization, you could be spinning your wheels and not realizing the full potential of your systems and efforts.

STEP 2 – LINK DATA TO YOUR VALUE DRIVERS
The next step to ensuring you are making intelligent decisions based on relevant information is to verify that all data captured is linked to the value drivers of your organization. Every piece of information that is collected and processed is intended to provide new intelligence, thereby improving the positive outcomes of critical operational decisions. The way to optimally perform this is by linking significant data retrieval and performance functions to your value drivers. Furthermore, these links can be expanded upon where multiple associations exist.

Dissecting the specific data captured will allow organizations to assess data accuracy, timeliness, depth, and most importantly the interconnection with various other data sets and systems. The key is to ensure that crucial data is modeled to display how it is gathered, at what interval, and how data from one source is related to data in another.

STEP 3 – ANALYZE
Now that you have modeled all significant operational data, you will be able to focus on the highest impacting pieces. By designing new processes or re-engineering solutions, you will be able to increase the usefulness of the information. The analysis will be focused on interconnecting data, assets, management, and operational systems. This exercise will require a thorough look at the data to ensure that standards are in place and the collection of information is from across the entire organization in order to ensure corporate-wide accurate reporting. The outcome from the analysis is to design a roadmap that will focus on operational improvements tied directly to the value drivers of the organization. This can be initiatives such as: identifying ways to increase production, improve safety records, decrease maintenance costs, improve asset visibility, reduce compliance risk, and much more.

STEP 4 – SOLUTIONING
After defining opportunities to improve operations, organizations need to devote some time to developing a realistic plan of achieving these goals. A key step in the Solutioning process is developing the overall vision and detailing the various components of development in palatable sizes ready for execution. Increasing the capabilities of the organization through the design of new automated systems or enhanced analytics, processes and interfaces are just some of the improvements that can be realized. If structured properly, these enhancements can provide the organization significant wins by capitalizing on the information captured along the way.

Information Technology has assisted organizations in navigating from simple and non-existent data management environments, to an optimized level where data can be used for benchmarking and analysis to drive their strategic and operational initiatives. This cannot be successfully done however without ensuring that all data captured provides value and that value is something that drives the automation, analysis and design of advanced systems and integration opportunities. The following diagram depicts the stages of data management and provides a visual of where organizations currently are and how far they may have to go in order to achieve the most optimal level of data management:

Data_Management

Thursday 19 September 2013

A hike gone awry as an analogy for Troubled Project Leadership

Post written by Jason Z., Project Manager at Ideaca. Read more about project management on his blog: Unnatural Leadership.

I have two fortune cookie fortunes on my desk at home – “promise only what you can deliver” and “now is a good time to finish up old tasks.” They are taped to the bottom of a picture frame with a picture of my wife and I from the day that she had a catastrophic accident hiking in the mountains. 

We were hiking “Bow Peak” with a friend in the middle of the summer and  decided to summit the peak. When we reached the peak, we realized that there were three paths down, but we had no guidance as to which path to take. Our goal was to get to the base of the summit, which connected to the safe path down. The first path was the one we came up, and it was all scree.  We didn’t really have the right gear to descend safely. The second path was down a rock chute to a wide open path, and we would have to walk an extra 15 km to get to the base of the summit. The third path was also down the rock chute, but it turned to a side of the mountain that we could not see.  However, we could see that it was a shorter route and would take us over some less dangerous scree to get us back to the base of the summit.

As a group, we identified the problem, recognized the constraints, discussed the risks of each path, and then chose the third path for our descent. Before we began, we agreed on some of our guiding principles for descending – such as only one person in the chute at a time so as to avoid being hit by tumbling rocks.

During our descent, we came across a part of the path that was previously unknown – we had to traverse and descend a small glacial formation. I went first, and having experience snowboarding, sat down on my heels and enjoyed the 60 foot slide. My wife (then girlfriend) went next, but did not have the same experience. She slid out of control and ended up breaking two teeth and puncturing her lip on a flat top rock. As she was sliding, I was trying to give her all of my knowledge of how to control the uncontrolled descent by yelling four words – “dig in your heels.” She yelled back “I am! I am!”  I didn’t offer her how to do so, or what else to do with her body when she was doing so. And so, as she was sliding, I was sprinting across the base of the ice to catch her before she hurt herself. I was too late, and we ended up spending the night in hospital followed by the next morning with a dentist to perform some emergency repairs.  The final result was that she endured 20 stitches in her lower lip and now has 2 false teeth.  While she will still come hiking, she is not as exuberant to go as she once was.


Our friend – who happened to have a med kit – ended up taking the 'safe' route down by walking down the side of the glacier where it was primarily slush.

I have never forgiven myself for that accident, but have never thought about the leadership lesson associated with it. In the short time span of her fall, I could not even begin to communicate the depth of my experience to ensure that she would be successful with her journey. I had just assumed that it would be fine if I showed her how to do it. When I saw she wasn’t getting it, I started yelling louder hoping she would get it.

By reflecting on this hiking experience, I now understand some of the more tumultuous projects that I have managed and participated on:
  1. As we prepared for our descent, we discussed our guiding principles for descending. Creating a shared vision through detailed planning is the logical way to get a team ready to move forward with a project. However, I have observed, and participated on, project teams that just move forward without considering what could go wrong.
  2. Project teams have disparate skill sets. While some members may be perfectly happy to “descend the glacier,” others may not be. Ensure that teams have a safe path to move forward without getting hurt.
  3. When the pressure is high and time is short, yelling does not help anything.
My lesson to be applied is thus:
  1. Be deliberate with your plans
  2. Consider skill sets
  3. Having someone with experience walking the path can provide helpful guidance, but they do not necessarily add value when they are “in charge.”
Long hikes are a lot like projects. To descend the mountain safely, you need to honestly assess team skills, previous experience, and know how to prevent catastrophic accidents. Never walk the path blindly.

Tuesday 17 September 2013

Setting expectations with clients (part 2)

Post written by Steve J, Project Manager at Ideaca

Setting Expectations with Clients Part 2 is a two part blog series on managing client expectations. See here to read part 1.

In my previous blog post, I told a story about a project I was involved in that required expectations to be managed and the project to be pivoted. In this blog post, I will discuss four key factors in managing expectations that I have learned throughout my career.

1. Communication is a key factor when working with clients. No two clients are the same, some will hire a team to complete a specific task, while others will want to be fully engaged. Learning how and when to communicate with these different groups is crucial to project success. Fully engaged clients may require daily or even hourly updates on project status while more removed clients may only want occasional updates. Knowing your client and making decisions on when and how to communicate is an important way to manage expectations. Some of the effective communication mechanisms that we use on projects can include: daily stand-up meetings with the entire project team (including the client), weekly status reports with all items completed that week, any issues or decisions that arouse, and a budget burn down showing progress. Email is a very handy tool for communication, however if a portal (SharePoint or something similar) is available, this technology will allow for much tighter control over issues, questions, and decisions on the project, without the issues with email branching off into numerous threads and side conversations.

2. Building a relationship on honesty is necessary. Right from the first meeting, the client should understand what you can and cannot do for them. As much as we wish we could offer solutions to every problem, the reality is we can only do what is within scope and within our knowledge and skills. While digging into the details of what that desired end state will be, it is important to discuss what is possible and what is not. These discussions will affect the project and the decisions made will impact the deliverables, the timelines and especially the budget. The hope of this is to catch and identify any areas of the project that may lead to deliverables not being delivered, budgets and time frames expanding and missing expectations.

3. Deciding the roles and responsibilities for the project team (including the client team members as well) is a major task that should be completed at the start of the project. From the start of the project, setting up a project Governance is a great way to start. Project Governance will outline the relationships between all groups involved in the project, define the flow of information from the project to all key stakeholders, and ensure that there is appropriate reviews of all issues during the project. Another useful tool is to create a RACI Matrix. A RACI matrix describes the participation by various roles in completing tasks or deliverables for a project or business process. It is especially useful in clarifying roles and responsibilities in cross-functional/departmental projects and processes. Key contacts for the different areas of the project should be also defined. It’s important for everyone to know who to go to for questions and issues with certain aspects of the project and to keep these people consistent from kick off to go live. In projects I have been on, we start the project with an internal kick off meeting before we meet with the client. This ensures everyone is on the same page and has a shared understanding of the project and statement of work. On the first day of work with the client, we begin with a similar meeting. At this point we can assign the key contacts on my project team as well as the clients’ team. Everyone involved on both sides will have had chance to meet and put a name to the face and to their role.

 4. “When is the due date and when can we launch this project?” should be questions that are asked and answered early on. Making sure to develop a realistic project plan adds transparency to the project, shows when the milestones are due and provides everyone responsibilities and accountabilities. The project plan is a living document. It should exist to provide everyone an up to date snapshot of where things are in the project. If there are delays or changes made, the project plan should be updated and discussed with the client immediately. When it comes to managing expectations, establishing clear and consistent deadlines are a necessity. The sooner deadlines are set, the sooner the team can begin to work to ensure they meet them.

Every new project allows for lessons learned or growth, both for the team and the individual. Personally, I have learned so much about managing expectations from every project I have ever worked on. Every client is different and understanding how to work with them is part of having a successful project. Communications, honesty, assigning tasks and confirming deadlines are four key aspects of managing expectations that are part of my expectation management strategy for every project. Ultimately you want to start the project the same way that you finish it: with happy clients!

Thursday 12 September 2013

The data has the answers

Post written by Evan Hu, Co-founder of Ideaca. View his blog here: evanhu.wordpress.com


Data_graphic_2
In a 2001 research report by META Group, Doug Laney laid the seeds of Big Data and defined data growth challenges and opportunities in a “3Vs” model. The elements of this 3Vs model include volume (the sheer, massive amount of data or the “Big” in Big Data), velocity (speed of data processed) and variety (breadth of data types and sources). Roger Magoulas of O’Reilly media popularized the term “Big Data” in 2005 by describing these challenges and opportunities. Presently Gartner defines Big Data as “high-volume, high-velocity and high-variety information assets that demand cost-effective, innovative forms of information processing for enhanced insight and decision making.” Most recently IBM has added a fourth “V,” Veracity, as an “indication of data integrity and the ability for an organization to trust the data and be able to confidently use it to make crucial decisions.”

The volume of data being created in our world today is exploding exponentially. McKinsey’s 2012 paper “Big data: The next frontier for innovation, competition, and productivity” noted that:
  • to buy a disk drive that can store all of the world’s music costs $600
  • there were 5 billion mobile phones in use in 2010
  • over 30 billion pieces of content shared on Facebook every month
  • the projected growth in global data generated per year is 40% vs. a 5% growth in global IT spending
  • 235 terabytes data was collected by the US Library of Congress by April 2011
  • 15 out of 17 sectors in the United States have more data stored per company than the US Library of Congress

IBM has estimated that “Every day, we create 2.5 quintillion bytes (5 Exabyte) of data — so much that 90% of the data in the world today has been created in the last two years alone." In their book “Big Data, A Revolution That Will Transform How We Live, Work, And Think,” Viktor Mayer-Schonberger and Kenneth Cukier state that “In 2013 the amount of stored information in the world is estimated to be around 1,200 Exabytes, of which less than 2 percent is non-digital.” They describe an Exabyte of data if placed on CD-ROMs and stacked up, they would stretch to the moon in five separate piles.

This sheer volume of data presents huge challenges. For time-sensitive processes such as fraud detection, a quick response is critical. How does one find the signal in all that noise? The variety of both structured and unstructured data is ever expanding in forms: numeric file, text documents, audio, video, etc. And last, in a world where 1 in 3 business leaders lack trust in the information they use to make decisions, data veracity is a barrier to taking action.

The solution lays ever more inexpensive and accessible processing power and the nascent science of machine learning. While Abraham Kaplan (1964) principle of the drunkard’s search holds true: “There is the story of a drunkard, searching under a lamp for his house key, which he dropped some distance away. Asked why he didn’t look where he dropped it, he replied ‘It’s lighter here!’” A massive dataset that all has the same bias as a small dataset will only give you a more precise validate of a flawed answer, we are still in early days. Big Data is the opportunity to unlock answers to previously unanswerable questions and to uncover insights unseen. With it are new dangers as the NSA warrantless surveillance controversy clearly exposes.

I have had the privilege of listening to Clayton Christensen speak several times. In particular he has one common through line that stuck with me and forever embedded itself in my consciousness. “I don’t have an opinion. But I have a theory, and I think my theory has an opinion.” I believe the same for Big Data. The data has an opinion, the data has the answers.

Tuesday 10 September 2013

Setting expectations with clients

Post written by Steve J, Project Manager at Ideaca

The Oxford Dictionary defines “managing expectations” as: “Seek to prevent disappointment by establishing in advance what can realistically be achieved or delivered by a project, undertaking, course of action, etc.”

Almost every part of our lives is surrounded by expectations, either ones we set for ourselves or ones that were set for us by others. When it comes to consulting and being on a project, every part of the project experience will be influenced by expectations. There will be expectations around the project as a whole, the deliverables, the time and especially the budget. It is the responsibility of the project team and Project Manager to ensure that the client has a clear and accurate understanding at all times. The overall success of any project will be linked to the expectations of the client, the understanding and efforts of the project team and how well these factors align. At the end of a project, the client’s satisfaction with the delivered project will determine its success.

I have worked on a variety of projects, including those with high expectations from the client. In one project the client as a whole had very little technical and user knowledge of the system that we were implementing for them. They were very much involved in the project and took on many tasks. One of the tasks that was completed by the client was the design and layout of the new system. This task was completed before the project team started on the project and with limited knowledge of the system. The designer was able to design the pages to match that of a SharePoint look and feel without any operational knowledge of the system as a whole. The project team was not a part of this design and the client wanted the end result to look and operate the same as they had designed it. When our project team realized this, we had to pivot our work to align with a more customized solution rather than an out of the box implementation as originally expected. Communication and managing expectations became a critical component of this project, especially since the plans and timelines shifted substantially. Working closely with the client, being honest about timelines and budget and reviewing changes before work continued were very important. Our open communication kept the client informed and the project team on the right track to meeting their needs. In conclusion, the client was very happy with the end product and assured us that we had exceeded their expectations.

Through my experience working with a variety of clients in different situations, I have developed an understanding of how to best manage client expectations. As in the example above, the situation could have turned out with one, or both parties upset about the changes in plans. But by effective expectation management, we were able to explain to the client why things needed to change and what exactly we were going to change. This turned a potentially problematic shift in work into a positive improvement of work.

In my next blog entry, I’ll cover the four key factors in managing client expectations that I have learned throughout my career. Check back next Tuesday, September 17 for more! 

Monday 19 August 2013

Are you losing count of your employee’s billable hours?

Information taken from Ideaca’s “Revenue Leakage in Professional Services: How to Quash the Silent Killer of Profitability” whitepaper.

Professional services organizations (PSO’s) of all sizes and from all industries struggle to track service hours in a consistent and accurate way. Many organizations use tracking protocols that are inefficient and create challenges for accounting and finance departments. Often these protocols are spreadsheet based and not standardized. As a result, excessive time is spent on consolidation and organization, with hardly any time spent on strategy and analysis.

In many cases, organizations don’t realize where their billable hours are going and that small factors can make a big difference in accurate reporting. The following are examples of some of the small factors that lead to inaccurate time reporting:

  • End of month time tracking: Many people have trouble accurately recalling the hours they worked at the start of the month by the time they submit their hours at the end of the month. Not everyone keeps personal records of their hours and those who don’t rely on memory and guesses.
  • Time entry is late: When time entry is delayed because of vacation, technical difficulties or other causes, it is not always clear when submission deadlines are postponed to. As a result, employees may neglect to submit their time because they are unaware how and when they should.
  • No standardization: Without clearly defined guidelines for tracking time, there may be confusion over what is and is not considered to be billable. Defining ambiguous reporting areas like travel time and administrative work leads to accurate and consistent reporting across the organization.
  • Inaccurate manual processes: As with all manual processes, errors can happen unknowingly. Employees may rush through their time sheet or make costly but minor mistakes when reporting.

Many real-time, accessible and centralized time entry systems are available to empower organizations. Not only do they streamline and increase efficiency of accounting and finance departments, but they benefit employees as well. With accurate information about their hours, employees gain insight into how they directly affect the bottom line and they gain access to metrics about their project or personal hours.

View the full “Revenue Leakage in Professional Services: How to Quash the Silent Killer of Profitability” whitepaper here.

Wednesday 14 August 2013

Statement of Direction for Dynamics AX 2012 "R3"

Microsoft recently released their latest Statement of Direction for Dynamics AX 2012 R3. This new version of AX will be available by Q4 of 2013 and will come with a number of benefits and new capabilities. These include:

Warehouse Management
Advanced warehouse management capabilities will be introduced including embedded RFID, improved warehouse processing and rate, and route and load planning.

Introduction of Demand Planning
There will be new functionality to support SKU-level demand planning based on the Time Series algorithm of SSAS.

Retail
R3 has a strong focus on retail capabilities, with key areas including mobility, clientelling, ecommerce and social.

E-Procurement
Capabilities for purchasing within complex organizations will be enhanced, specifically in the management and control of the RFX (RFI, RFP & RFQ) processes.

Budget Planning
There will be improvements in budget planning capabilities with a focus on supporting the planning needs of complex organizations.


R3 will offer many new and improved capabilities that AX 2012 R2 does not offer. This new version will benefit large and complex organizations the most, especially those with Distribution and Omni-Channel Retail.

The next major version of AX will be released at the end of 2014 and will be called “Rainier.”


Read the full Statement of Direction here.

Questions? Ask one of our consultants.

Tuesday 6 August 2013

Is your website mobile friendly? Here's why it should be.


Many people believe that it is sufficient to only offer desktop computer versions of a website because that’s where people primarily use the internet. However, recent studies by Pew Internet have discovered that this is not the case. Increasing numbers of people primarily use their mobile devices to research or surf the internet. In some cases, these people do not have access to a desktop computer, have to share it, or prefer the convenience of their mobile devices. These mobile-only customers are as valuable as desktop computer users and need access to the same information.

How many people fit into this mobile-only category? A lot, especially young adults between 12 and 29 and low income adults. If your customers fit into either of these categories then it is especially important to make sure your website information comfortably fits onto a mobile screen. Even if your customers do not fit into these categories, more than half of all Americans used their mobile devices to browse the internet in 2012. This means that even if it isn’t your customer’s primary internet method, they may still be accessing your website and information on their mobile devices.

It is important not to force mobile only users to find a desktop computer to access your information. As well, forcing customers to zoom and scroll to navigate a site designed for a much larger screen will only frustrate them and detract from your valuable information and services. The good news is that mobile-only users may access the internet differently but they do not need unique information. The same messaging, content, services and offerings that you share on your website can be duplicated on your mobile site. Even the colors and branding used can and should remain consistent. This means that including a mobile site requires only technical changes and not major messaging or branding shifts.

Embracing customers regardless of the way they browse the internet is the best way to make sure your content is available and accessible. This ensures no potential customers are excluded, no matter the way they choose to browse the internet.

Sources: Pew Internet, Harvard Business Review Blog

Tuesday 28 May 2013

Have you adopted mobile and tablet retail technologies?


If you haven’t, you might be falling behind and missing out on valuable opportunities.


Advancements in technology bring changes in retail and the way that people shop. Customers are no longer satisfied with customer service only at the till, promotional offers they don’t relate to and primarily using cash to pay. At the same time, retailers want to save money and gain valuable insight into their customers and how they shop. Retailers and customers can satisfy both of their wants with modern payment technologies.

Retailers face many challenges when considering new payment methods including cost, customer security and the speed of transactions. Growing technologies such as mobile payments improve customer convenience, reduce fraud and help retailers learn more about their customers. As for security, mobile payments offer security levels comparable to EMV, but without the expensive hardware. With the right technology, payments can be made on devices such as tablets. This allows employees to take payments from anywhere in the store without having to move heavy or awkward equipment. Tablet payment technology also offers access to information formerly limited to the till such as available inventory. 

When customers know that providing information leads to an improved shopping experience, they are more likely to provide retailers with their personal data. Retailers can then use this information to learn about their customer’s shopping habits and even customize offers to fit their exact interests. Various technologies are now available to assist in collecting and using this data efficiently. By implementing the right software, you can gain valuable access to your customers shopping preferences and habits, while benefiting customers with customized offers. 

While the future of retail technology is unclear, it is likely that mobile payments and tablet technologies will become more common and the benefits of collecting customer data will become more important. Retailers who adopt modern technologies today will better prepare themselves for the future and coming changes in retail. If you’re interested in learning more, Ideaca has knowledgeable consultants that are happy to discuss what technologies are right for you and your business.